About the author

Learn the basics of the new generation of Google Analytics
The days of Universal Analytics (UA) are now behind us as Universal Analytics was scheduled to stop processing data on July 1, 2023.
Most companies have started to adopt the use of Google Analytics 4 by either manually migrating and setting up GA4 themselves, or using GA4’s Setup Assistant tied to the old Universal Analytics property. The challenge many new users are facing now is learning and mastering the new generation of Google Analytics. It’s important to know that Google Analytics 4 is still under development, so there will likely be some changes to the platform in the future.
This comprehensive guide to GA4 will focus on the basics of Google Analytics 4, Google’s new generation of analytics. We will cover the following:
- What is GA4?
- How it’s different from Universal Analytics
- Changes to the analytics interface and reporting metrics
- New features in GA4
- Data retention
- Reporting
- Advanced integrations
Read on to learn everything you need to know about GA4 and how to apply it to your business.
What is Google Analytics 4?
Google Analytics 4 (GA4) is the latest version of Google’s popular web analytics platform. It was introduced to provide an enhanced and more comprehensive way of tracking and analyzing user interactions on websites and apps. GA4 represents a significant update over its predecessor, Universal Analytics (UA).
To new adopters, GA4 is considered a new product. However, it was officially launched in 2020. For many digital marketers, it took a considerable amount of time to embrace its usage, a trend that continued until 2022, until Google announced it would be fully deprecated in 2023.
The migration to GA4 may seem daunting, but there are some silver linings. Automatic event tracking makes it a lot easier to capture user behavior, and the new features that have shifted from GA360 will excite digital marketers as they start familiarizing themselves with how the new data model works.
How is GA4 different from Universal Analytics?
Many new users ask themselves: “what’s so different about GA4 vs. Universal Analytics?”. The new platform is a complete rebuild and Google’s most dramatic update since 2005, meaning it comes with many new features, a completely different user experience, and new ways of collecting, organizing, and processing data. They’ve also started releasing more updates based on feedback from the community to make it easier for people to work on the platform.
Depending on if and when you set up your property, the new platform comes without your website’s historical data that you used to monitor in Universal Analytics. The good news is that you’re still able to access and reference your website’s historical data through the UA property through July 2024.
What will be changing with some of the new GA4 features?
Google Analytics 4 includes a new event data model, a new interface, a new measurement of behavior, and is more privacy-focused than Universal Analytics.
Here are a few of the most important changes to be aware of:
GA4 Features
A new event model focused on users and events
One of the most significant changes in GA4 is the pivot from a session-based model to an event-based model. Previously, Universal Analytics only tracked pageviews. Customizing it to track additional page interactions required more advanced knowledge of setting up event tracking via Google Tag Manager.
Automatically collected events
Automatically collected events are events that are automatically tracked by Google Analytics 4 (GA4) after you install the GA4 base code. These events include basic interactions with your website or app, such as viewing a page (page_view), starting a session (session_start), or making a first visit (first_visit).
Enhanced measurement events
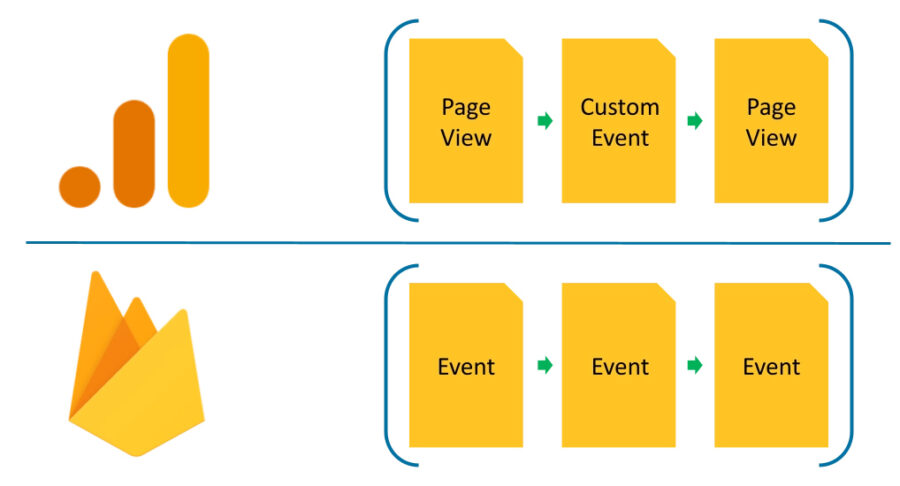
GA4 is automatically ready to collect additional data through “Enhanced measurement”. This means we’re moving from specific hit types, such as page view, event, social, or transaction, to a world where everything that gets tracked is an event. It’s then up to us to stitch these events together. For example, session start -> page view -> first visit -> form submission.
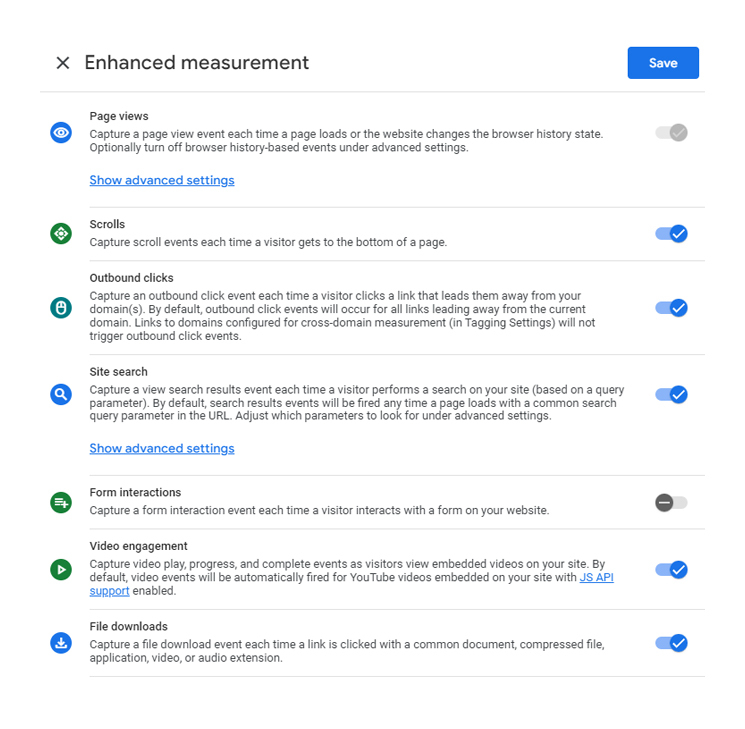
“Enhanced measurement”, allows you to collect data on scrolling, outbound clicks, site search, form interactions, video engagement, file downloads, and more.
Recommended events
Recommended events are events that are not automatically sent to Google Analytics, but can be manually added to your website or mobile app to measure additional features and behavior. This can help you generate more useful reports and insights into your users.
Custom events
Custom events are events that you can set up yourself to track specific actions on your website or app. For example, if you run an ecommerce store, you might set up an error event after the “begin_checkout” event to track what users do when they encounter an error during the checkout process. This information could then be used to improve the checkout process.
A new customizable analytics interface
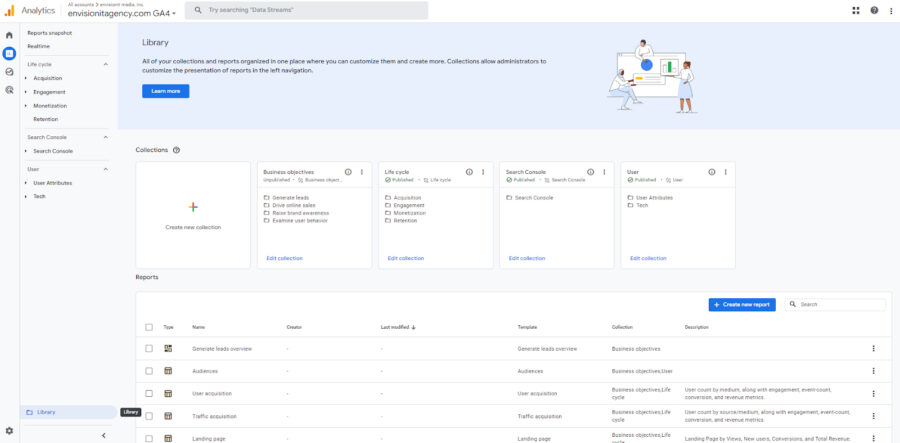
While a lot of the standard reports from UA are missing, Google Analytics 4 allows you to tailor your experience and build out custom reports. This means you can start making Google Analytics 4 unique to your business needs by exploring how you want this organized within the Reports Library.
GA4 metric changes and updates
It’s important to note that with Google’s new approach to measurement, some metrics that you’re used to seeing are either slightly different or no longer in the analytics platform. You’ll want to understand the differences when doing comparisons using data from your UA property.
Here are a few key changes in GA4 metrics that you should be aware of:
Attribution metrics
Users:In an attempt to de-duplicate and be more accurate, users have changed a bit. In UA, Device ID was the primary mechanism of identifying users, however in GA4 there are now three different methods:
- User ID: This is a unique identifier that you can create and assign to users. This is the most accurate way to identify logged in users.
- Google Signals: This is a way to anonymously track users across devices and platforms. It uses a combination of data from Google products, such as Chrome and Android, to create a unique identifier for each, but it requires users to opt in.
- Device ID: This is the least accurate way to identify users, but it is the most reliable. It uses the device’s unique identifier, such as the IMEI or MAC address, to track users.
The method that GA4 uses to identify users will depend on the settings that you have configured. You can choose to use a single method, or you can use a combination of methods.
Total Users was previously the primary user metric in UA which represented the total number of users that visit your site. In GA4, it is the total number of unique users who logged an event.
Active Users is now the new primary user metric in GA4. It measures the number of distinct users who visited your website or application. An active user is any user who has an engaged session or when analytics collects:
- the first_visit event or engagement_time_msec parameter from a website
- the first_open event or engagement_time_msec parameter from an Android app
- the first_open or user_engagement event from an iOS app
New Users in GA4 is similar to UA as it represents the total number of users who interacted with your site for the first time. In GA4, this metric is specifically triggered by the first_open event.
Sessions are a group of user interactions with your website or app within a specified period. A session begins when a user first interacts with your website or app, and ends after 30 minutes of inactivity. Sessions are not restarted at midnight or when new campaign parameters are encountered. If a user comes back after a session timeout, it will start a new session.
Engagement metrics
As you explore the GA4 you’ll start to notice a new session metric labeled with the term “engagement”. Below we’ve outlined some helpful details around these engagement metrics in GA4.
Engaged sessions is a session that meets one of the following criteria:
- It lasts longer than 10 seconds.
- It includes a conversion event.
- It includes at least two pageviews or screenviews.
Engagement rate is the percentage of engaged sessions and is calculated as Engaged sessions divided by Total Sessions. It was originally intended to replace the bounce rate but the GA community later asked for the bounce rate back.
Bounce rate previously was the percentage of single-page sessions in which there was no interaction with the page. This is now the inverse of the engagement rate. The percentage of sessions that were not engaged. ((Sessions Minus Engaged sessions) divided by Sessions).
Engagement time is the time that a user’s screen is focused on your website or app. This means that time spent on a page that is not in focus, such as time spent with the tab minimized or the window in the background, is not counted as engagement time.
Average engagement time per session measures the amount of time users spend actively engaging with your website or app during a session. It is calculated by dividing the total engagement time by the number of sessions. It is a more accurate measure of user engagement than the previous Universal Analytics metric, Average Time on Site.
Views are the total number of app screens and/or web pages your users saw. It is the equivalent of UA’s pageviews.
Views per sessions is the number of app screens or web pages your users viewed per session. (screen_view + page_view events) / sessions. It is the equivalent of UA’s pages/session
Conversion metrics
UA’s goals are also changing into “conversions” within the new GA4 platform. Conversions are the count of conversion events. By default, GA4 counts every instance of the conversion event, even if the same conversion event is recorded multiple times during the same session. More recently in April 2023, Google now allows you to change the counting method to count only once per session to operate closer to Universal Analytics goals.
Session Conversion Rate is the equivalent of UA’s Goal Conversion Rate. The formula for this metric is the percentage of sessions in which any conversion event was triggered. One important difference to note is that this does not act like the UA’s goal conversion rate formula. UA’s Goal Conversion Rate Formula used to be (Total Conversions / Total Sessions) * 100. With Session Conversion Rate, the formula now is (Conversion Sessions / Sessions) * 100.
User Conversion Rate is the percentage of users who triggered any conversion event. It is calculated by dividing the number of users who triggered any conversion event by the total number of users.
Ultimately, the best use case for session conversion rate and user conversion rate will vary depending on your specific goals and objectives. However, both metrics can be valuable tools for understanding the effectiveness of your website or app and making improvements to boost conversions.
For a full breakdown of all the dimensions of metrics, explore Google’s resource [UA→GA4] Comparing metrics: Google Analytics 4 vs. Universal Analytics
GA4 data retention
In the new platform, Google introduced a Data Retention limit. In Google Analytics 4, this represents the amount of time that data is stored in your GA4 property. The default data retention period is 2 months, but it is recommended that you change it to 14 months.
The data retention setting only affects the following:
- Explorations: Custom reports that you create in GA4.
- Funnel reports: Reports that track the steps that users take to complete a goal.
- Age, gender, and interest data: This data is always retained for 2 months, regardless of your settings.
Keep in mind that the data retention setting does not affect standard aggregated reports (including primary and secondary dimensions) in your Google Analytics 4 property, even if you create comparisons in the reports. The data retention setting only affects explorations and funnel reports, as stated by Google.
Here are some factors to consider when choosing a data retention period for your GA4 property:
- The amount of data that you collect.
- The length of time that you need to keep the data for.
- The privacy regulations that apply to your business.
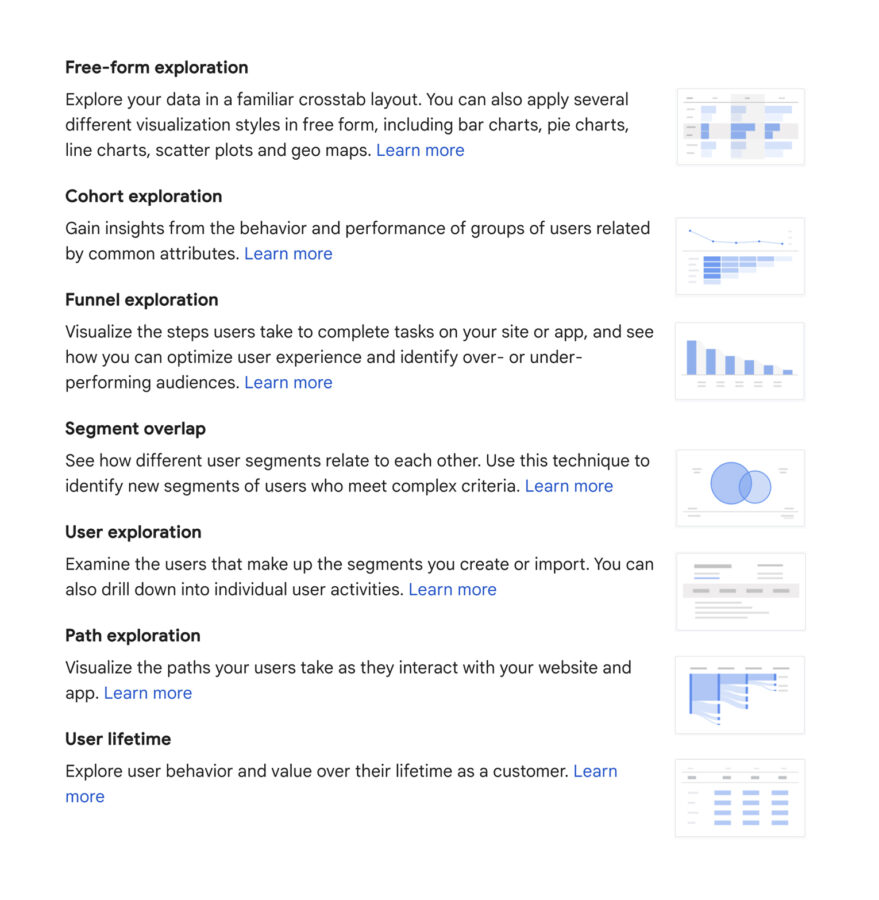
Reporting in GA4
With GA4, we’re going from out-of-the-box, predefined reports to custom detail reports with advanced flexibility to build out what you want to see. Google Analytics 4 also introduced Exploration Reports. They are a great way to explore your data and find new insights to drive continued performance and growth in your digital marketing efforts.
Additionally, Google added advanced machine learning to create efficiencies and improve performance insight discovery. It will require additional planning work to configure various reports that your team finds helpful based on your unique marketing or campaign objectives, but once established, it should be smooth sailing.
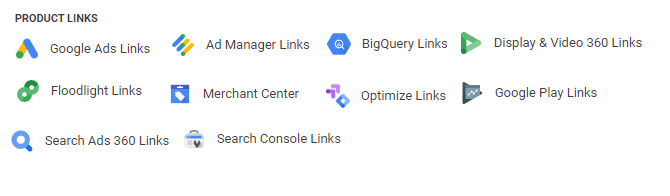
Enhanced integrations
One key benefit with the migration to GA4 is that it offers more integrations with other Google products, such as BigQuery, Floodlight, and Google Ads, which makes sharing data between the platforms and taking action on the insights a bit easier. Some of these links were originally only available to GA360 users.
Wrap Up
Google Analytics 4 (GA4) has completely replaced Universal Analytics (UA). Marketers who started using GA4 years ago had the opportunity to learn about its new features and start collecting historical data.
Those who have waited until now may find it difficult to understand the new event-based model, navigate the vastly different interface, or explore the new reporting features.
However, the new generation of analytics offers a new data model with a better approach to measure user behavior and features previously only available to GA360 users. These insights can be used to make data-driven decisions once you overcome the learning curve of a new analytics platform.
Here are some specific changes that marketers should be aware of when switching to GA4:
- GA4 is event-based, rather than session-based, which means that each interaction with your website or app is tracked as a separate event.
- The GA4 interface is completely different from UA, so you’ll need to learn how to navigate it.
- GA4 offers a wider range of reporting features than UA, but they can be more difficult to use.
If you are new to Google Analytics 4, I recommend taking some time to learn about the new features and how they differ from Universal Analytics. There are many resources available online, including the Google Analytics 4 documentation.
If you’re feeling overwhelmed or want to learn how your business can use GA4 to strengthen your digital marketing insights, get in touch.
Additional GA4 Resources:
- Universal Analytics is going away →
- Stay up to date – GA4 Official Updates Timeline →
- [GA4] Introducing the next generation of Analytics, Google Analytics 4 →
- [UA→GA4] Universal Analytics versus Google Analytics 4 data →
- [UA→GA4] Comparing metrics: Google Analytics 4 vs Universal Analytics →
- Get Your Google Analytics Certification →
- Looker Studio: Connect and visualize your data →